Timeline of Major Trends and Events (Social, Technological, Economic & Political)
By ericblue Categories: History InfoViz Interesting Religion Technology | 9 comments
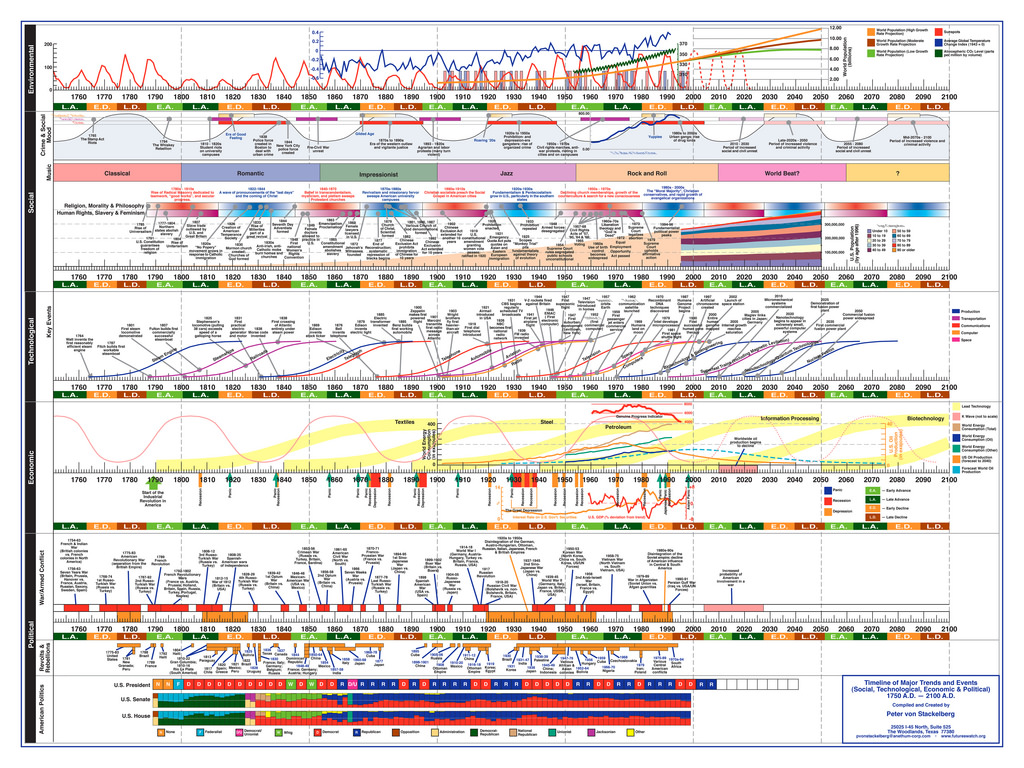
I found a unique and visually
stunning infographic on FlickR
today:
Timeline of Major Trends and Events (Social, Technological, Economic & Political)
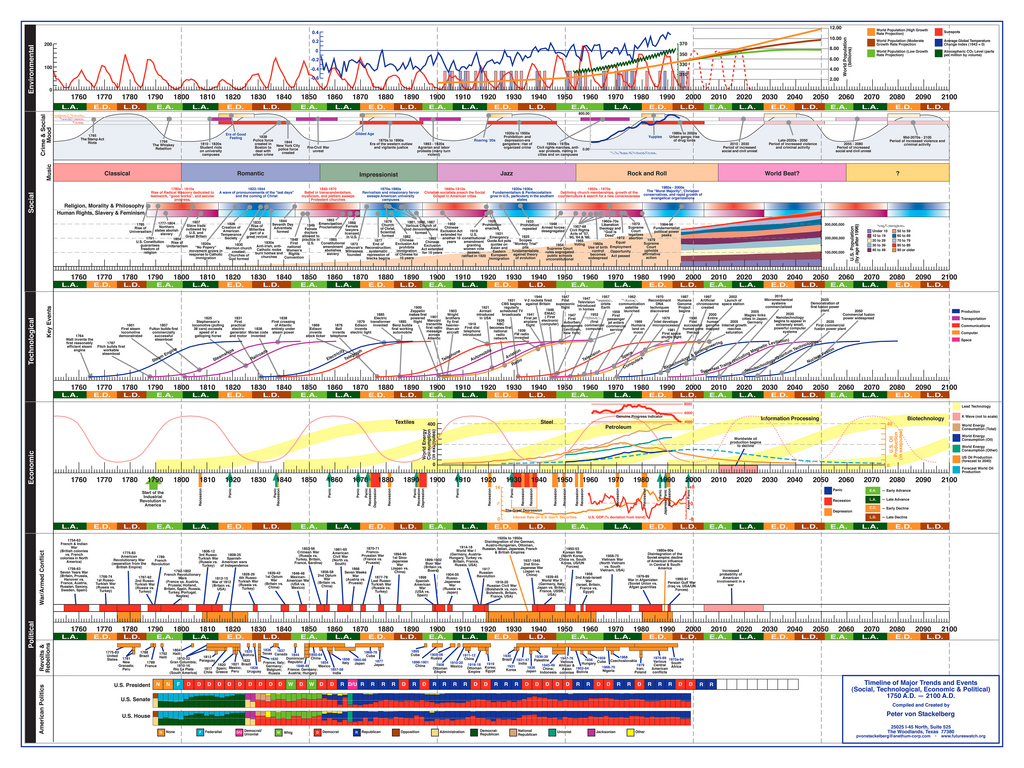
Peter von Stackelberg designed this complex timeline of social, technological, economic and
political events and trends from 1750 to 2100. Each time series shows graphs, events and categories
on a common scale. Peter says:
“The purpose of the timeline is to provide a visual tool for looking at events across a relatively long period of time and identify patterns and interrelationships involving a broad range of factors. Identification of patterns is particularly important when attempting to look at the future of complex social, technological, economic, and other systems.”
This graphic, and a number of others, can also be found on the Gallery of Data Visualization – Timelines site. Also, thanks to Stephen Lark (author of IntegralDiagrams.info) for uploading a high-res photo to Zoomorama. For some other great links see the comment below.
9 Responses
-
 Stephen Lark
I uploaded this to Zoomorama here to make it easier to zoom it to read the detail. I also uploaded 2 other history infovis diagrams that are not on Gallery of Data Visualization – Timelines: Wall Chart of
World History and Co-Evolution of Human Systems and Tool Systems -
ericblue76
Thanks Stephen, very good idea! I completely forgot about using something like Zoomorama. Also, thanks for the other great diagrams!!
-
ivan
Hi,
what software was used for making these infographics – something specific or something common (i.e. OpenOffice Draw)?
I use free program, named Calizo, for drawing timelines for myself, but it is specific fo timellines and has no ability to add graphics. -
Stephen Lark
Ivan, the author of this diagram is Peter von Stackelburg [email removed] www.futureswatch.org (these contact details are in the bottom-right of the diagram). E-mail Peter to find out what tool(s) he used to create the diagram.
-
ivan
Thank you, Stephen! Evidently, I lost my attention and power of observation, while watching the diagram… 🙂
-
Luke
Here’s a document where Peter von Stackelberg describes his motivation:
http://www.math.yorku.ca/SCS/Gallery/images/timelines/Stackelberg.txt -
Stephen Lark
Zoomorama is closing down so I migrated two of these diagrams to Closr.it:
Timeline of Major Trends and Events (Social, Technological, Economic & Political)
Co-Evolution of Human Systems and Tool Systems
I put the Wall Chart of World History on Flickr for now. -
Peter von Stackelberg
I just ran across your comments on my timeline and thought I might point out that the original (the version you show here) was created in 1998 with Macromedia Freehand. The most recent version (done in 2008) was created using Adobe Illustrator. I am currently working on an updated version and am exploring different applications that will make the timeline more interactive.
The concerns about information overload that have been noted by some users of the timeline is one that I have been trying to deal with since I did the very first version in 1994. It is a struggle to attempt to integrate the individual events and the broader patterns.
The timeline is intended as a tool for reflection. I literally sit back and look at the overall picture and then move in closer to see the details of something that catches my interest. I am hoping to be able to replicate this kind of user experience with an online version of the newest edition of the timeline. -
Eric Blue’s Blog » Weekly Lifestream for February 27th […] Shared Eric Blue’s Blog » Timeline of Major Trends and Events (Social, Technological, Economic & Pol…. […]
Comments are closed.